
What do Vancouver and Vienna have in common? Both cities land in the top five spots in the world rankings of the most liveable cities and cities with the highest quality of living conducted by the Economist Intelligence Unit (EIU) and Mercer, respectively.
City Rankings
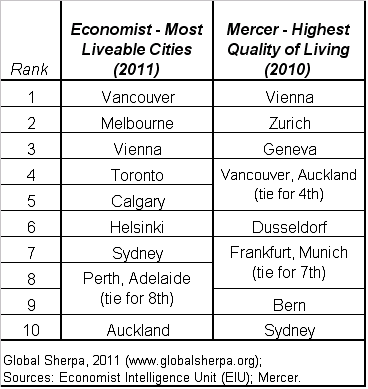
Vancouver and Vienna top the latest EIU liveability (2011) and Mercer quality of living (2010) surveys, respectively. Despite their mostly less-than-ideal climates, a host of Canadian cities rank disproportionately highly in both indexes, including Toronto, Calgary, Ottawa and Montreal.
On the other side of the globe, four relatively balmy Australian cities post top 10 rankings in the EIU survey, while the same four cities plus Canberra and Brisbane all rank in the top 36 spots in the Mercer survey.
Germany ties the U.S. for the most cities in Mercer’s ranking of the top 50 cities with the highest quality of living. However, all of Germany’s seven cities, including Stuttgart at No. 30, out-score the highest ranking U.S. city, Honolulu, which comes in at No. 31 just ahead of San Francisco in a tie for No. 32 with Adelaide.
The chart below presents the top 10 city rankings for the EIU liveability survey and the Mercer quality of living survey.

Compensation Tools
Both the EIU and Mercer quality of living studies have a practical purpose in mind. Governments and multinational companies use them to set compensation packages for employees who are relocated to new cities on international assignments. Mercer cautions readers against using the surveys as a basis for other purposes, such as tourism or foreign investment. Keeping this caveat in mind, the survey indicators and data still seem to be useful in shedding some light on the development priorities and progress of cities around the world.
Who’s Missing?
The world’s biggest cities are noticeably absent from the top of both the EIU and Mercer rankings. These cities generally fall into two camps: 1) very large, global cities in the world’s most advanced economies, including New York, London and Tokyo; and 2) comparably big, dynamic cities in rapidly urbanizing areas of the developing world, such as Jakarta, Manila, Mumbai, Sao Paulo and Shanghai.
Developing Countries
The rankings of big-name cities in developing countries seem easier to explain. Many developing countries have tended to follow an understandable pattern of putting basic development needs, such as income and housing, ahead of higher order social, cultural and environmental aspirations. By this line of reasoning, it’s simply too early to directly compare the scores of cities in highly developed and developing countries, other than as a yardstick to measure how far developing cities have come and how far they have to go in achieving the highest quality of living for their residents.
On the other hand, the argument can also be made that the sooner cities in developing countries start planning for reaching desirable liveability objectives, the better chance they have of ultimately reaching their goals. Fortunately, governments and other stakeholders in various developing countries seem to be recognizing the benefits of incorporating long-term, sustainable urban planning, environmental and other higher order considerations into their development experiences earlier than some of their more economically advanced counterparts may have in the past.
Leading Global Cities
London and New York rank 39 and 49, respectively, in the Mercer quality of living survey and only 53 and 56, respectively, in the EIU liveability survey. Paris, Tokyo and Milan come in at spots 34, 40 and 41, respectively, in the Mercer survey.
The relatively low rankings of leading global cities such as New York, London and Tokyo raises the simple question of how much of an obstacle the combined effect of size, complexity, diversity and globalization are to achieving the highest quality of living, at least from the perspectives of the EIU and Mercer rankings. In other words, is it practically possible for the world’s biggest, most diverse cities to achieve the same quality of living as other smaller, less complex cities? To that end, how would the next tier of cities in the U.S., U.K. and Japan fare by comparison to the top ranking cities in Australia, Austria, Canada and Germany. On the other hand, even if these challenges hold true, the world’s biggest cities can certainly improve and should still strive to achieve the highest quality of living possible.
Looking for a Pay Raise?
For the more entrepreneurially minded, the EIU and Mercer rankings could be read as a guide to the best cites for landing a nice plump pay raise. By this measure, the cities at the bottom of either ranking would actually end up becoming the most desirable destinations. Of course, the extra money that is intended to compensate for deficiencies in quality of living measures may or may not be worth it in the end.
Cities garnering the most lucrative hardship bonuses in the EIU and Mercer rankings include: Harare, Zimbabwe; Dhaka, Bangladesh; Lagos, Nigeria; Karachi, Pakistan; and Tehran, Iran. The chart below shows the scores for the ten cities at the bottom of the EIU’s liveability ranking. (Click on the image below to view the full-size chart in a separate browser tab or window.)

Eco-City Ranking
The Mercer quality of living survey includes a separate ranking of the most eco-friendly cities. The Eco-city index is constructed from six eco-indicators: water availability, water potability, waste removal, sewage, air pollution and traffic congestion. The chart below presents the top cities in the Mercer Eco-city ranking.

Approaches
Economist Intelligence Unit Liveability Survey
The EIU’s liveability index rates each city on a scale of 0-100 based on 30 indicators, grouped in five categories. Weights ranging from 10 to 25 percent are assigned to each category to determine the overall rating. The EIU’s categories, weights and indicators are as follows:
- Category 1: Stability (25%) (prevalence of petty and violent crime; threat of terror, military conflict and civil unrest/conflict)
- Category 2: Healthcare (20%) (availability and quality of private and public healthcare; OTC drug availability; general health indicators adapted from the World Bank)
- Category 3: Culture & Environment (25%) (climate; corruption; social/religious restrictions; censorship; sports/culture availability; food and drink; consumer goods and services)
- Category 4: Education (10%) (availability and quality of private education; public education indicators adapted from the World Bank)
- Category 5: Infrastructure (20%) (quality of road network, public transport and international links; availability of good quality housing; quality of energy and water provision; quality of telecommunications)
Mercer Quality of Living Survey
Mercer’s quality of living survey evaluates local living conditions in 420 cities worldwide. The Mercer quality of living index incorporates 39 factors, grouped in 10 categories as follows:
- Political and social environment (political stability, crime, law enforcement)
- Economic environment (currency exchange regulations, banking services)
- Socio-cultural environment (censorship, limitations on personal freedom)
- Health and sanitation (medical supplies and services, infectious diseases, sewage, waste disposal, air pollution)
- Schools and education (standard and availability of international schools)
- Public services and transportation (electricity, water, public transport, traffic congestion)
- Recreation (restaurants, theaters, cinemas, sports and leisure)
- Consumer goods (availability of food/daily consumption items, cars)
- Housing (housing, household appliances, furniture, maintenance services)
- Natural environment (climate, record of natural disasters)
The intended usage of the Mercer survey is limited to the transfer of employees from one country to another, and the index is not designed to be a basis for foreign investment or tourism. While many of the factors outlined above are also more broadly indicative of a city’s overall quality of living and level of development, the orientation of the index is evident in several areas, including the “economic environment” category’s emphasis on currency exchange regulations and the “schools and education” category’s focus on international schools.
Good Role Models?
While being mindful of the Mercer disclaimer above, both the EIU and Mercer rankings suggest that cities in Australia, Austria, Canada and Germany have many of their priorities in good order when it comes to balancing development objectives and indicators. While the world’s biggest cities may face greater challenges, the EIU and Mercer criteria and rankings provide useful tools and food for thought that all cities can incorporate in their efforts toward achieving the highest possible quality of living.
Related articles and content:
World Cities Page – Rankings, Development Facts and Article Links
Behind Norway’s #1 Prosperity Index Rating