
The Global Power City Index provides a ranking of the urban competitiveness of 35 world cities based on their international “magnetism.” This desirable-yet-elusive trait is defined as a city’s “comprehensive power to attract creative people and excellent companies from around the world amidst accelerated interurban competition.” While New York, London, Paris and Tokyo top the latest version of the Global Power City Index by a healthy margin, other prominent Asian cities, such as Seoul, Beijing, Shanghai, Singapore and Hong Kong, perform well in a number of specific areas. The performance of major European cities lags overall, but improves when viewed through the lens of a unique set of actor-specific city rankings for artists, residents and visitors. Major U.S. cities are particularly competitive in R&D and as a destination for researchers.
Global Power City Ranking
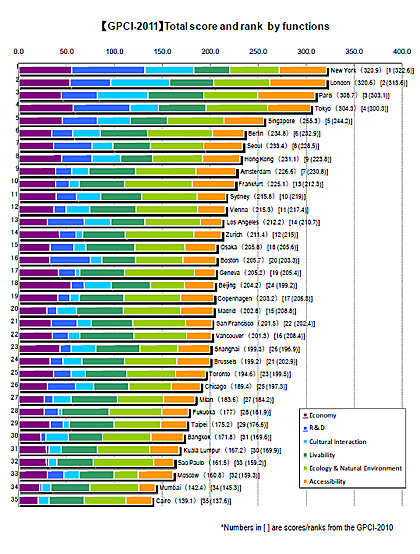
New York and London finish at the top of The Mori Memorial Foundation‘s Global Power City Index 2011 with nearly identical overall scores of 320.9 and 320.6, respectively. Paris and Tokyo earn third and fourth place honors a bit farther back, though their overall scores of 308.7 and 304.3 are well above those of fifth and sixth place cities, Singapore and Berlin, at 255.3 and 234.8. Although a relative newcomer to the role of global power city, Seoul, South Korea comes in seventh following closely on the heels of Berlin with a total score of 233.4. The chart below shows the 2011 ranking of the overall “magnetism” or urban competitiveness of 35 of the world’s most influential, global cities.

Each city’s multi-colored bar indicates the extent to which the six components of the Global Power City Index contribute to that city’s overall score. The six components of the index are: Economy, R&D, Cultural Interaction, Livability, Environment and Accessibility.
These six measures of a global city’s complex, multi-faceted personality make the Global Power City Index, according to the study’s authors, a broad measure of urban competitiveness rather than an evaluation of one or more particular aspects of a city’s character, such as livability. In this regard, the Global Power City Index is more comparable to The Urban Elite Global Cities Index by A.T. Kearney, Foreign Policy and the Chicago Council on Global Affairs than the well-known annual Livability and Quality of Living surveys by the Economist and Mercer, respectively.
Top Global Power Cities
New York, London, Paris and Tokyo represent a distinct first tier of the world’s most competitive global cities. The chart below compares the overall and function-specific scores of these four leading urban centers.

New York vs. London
The differences between New York and London are more a matter of degree than kind, though seemingly minor differences in rank can mask large competitive advantages, particularly in the R&D function. In broad terms, both cities rank at or near the top of the index for Economy, R&D, Cultural Interaction and Accessibility. London makes up for a relatively low R&D score, compared to that of chart-topping New York, by out-performing New York in three other functions: Cultural Interaction, Livability and Environment. Compared to their top rankings for other functions, the performance of both cities lags for Livability and Environment, with New York falling closer to the bottom than the top of the index in each function. London still manages to perform better than the average of its counterparts in these areas.
New York as a Global R&D Center
R&D stands out as a function that sets the competitiveness of New York apart not only from London but also from every other city in the index. As used in the index, the R&D function encompasses several sub-indicators, including: “Research Background,” “Research Achievement,” and “Readiness for Accepting and Supporting Researchers.” While London ranks fourth in R&D behind Boston in third and Tokyo in second, New York’s R&D score of 76.3 is 17.5 points higher than Tokyo’s second place score of 58.8 and 33.8 points higher than London’s fourth place score of 42.1.
In the absence of more detailed data from the full report on how the index is constructed, the large disparities in R&D competitiveness could depend more heavily on classification and measurement practices than other results considering the R&D function has the largest gap in top and bottom scores of the six components of the index.
Tokyo as a Global Power City
The report highlights Tokyo’s stature and competitiveness as a leading global power city. In addition to its high overall ranking, Tokyo ranks among the top five cities in five out of six function-specific areas. In the remaining area, the Environment, Tokyo comes in sixth with just two-tenths of a point less than fifth place Vienna. On the other hand, the authors also acknowledge that “although Tokyo is above average in all functions, it does not have the kind of stand-out strengths that the top three cities possess, thus keeping it firmly in the No. 4 spot.”
The report identifies a number of more specific factors in Tokyo’s overall and function-specific rankings. Reducing travel times from Tokyo’s Narita Airport has bolstered Tokyo’s Accessibility rating relative to other major Asian cities. In the short-term, the global economic downturn has helped Tokyo’s ranking for the Economy function.
When it comes to longer term trends, however, Tokyo has been giving up ground due to “decreasing scores for [the] presence of top companies and visitors from overseas.” At current rates of change, the study’s authors contend that Singapore would catch up with Tokyo in seven years.
Asian Cities Rise
Led by Beijing, the overall rankings of the report’s “major cities of Asia” – Seoul, Hong Kong, Beijing, Shanghai and Osaka – rose across the board. Beijing “leapt” a healthy six spots from No. 24 to No. 18. For the Economy function, Beijing ranks a strong third with 55.0 points, just half a point back of second place New York and slightly further ahead of fourth place London. Singapore, Hong Kong and Shanghai take spots five, six and eight, respectively, with scores of 43.3 to 45.4. The table below presents the overall and function-specific scores and rankings for several of the major Asian cities in the index. (Click on the image to view the full-size table in a separate browser tab or window.)

Some Unexpected Outcomes
In a few cases, the rankings and scores for some cities may raise questions about the choice of sub-indicators and construction of certain aspects of the indexes. For example, Tokyo’s No. 1 ranking for the Economy function is somewhat curious considering the prolonged periods of lackluster economic performance Japan has experienced for some time. It’s somewhat hard to tell from the limited data available in the summary version of the report, but it seems that the Economy function might over-weight some static factors and under-weight other relevant indicators, such as entrepreneurial activity, access to capital, and the fluidity of labor markets.
To an observer from the U.S., it’s likely surprising to see the Livability rankings of appealing cities like Chicago, Los Angeles and Boston wind up below those of Mumbai, Beijing, Sao Paulo and Cairo. Near the bottom of the Livability index, Bangkok and Moscow in spots No. 31 and No. 32, respectively, even manage to beat out Los Angeles at No. 33 and Boston in the next-to-last position at No. 34, despite Moscow ranking last by a relatively wide margin for the Environment function.
It would also be interesting to see how the cities’ rankings and scores would be affected by normalizing them relative to the size of their economies or populations.
Actor-specific City Rankings
The Global Power City Index makes a noteworthy contribution to the analysis of urban competitiveness by developing a unique set of actor-specific rankings. The report presents separate indexes that rank each city’s appeal to five different types of users: Managers, Researchers, Artists, Visitors and Residents.
The authors constructed a general profile for each type of city user with a set of specific behavioral and demographic characteristics. The Manager profile example from the summary version of the report consists of a middle-aged expatriate businessman with a family who is taking on a promotion in a foreign branch office. The Researcher is a young Ph.D. candidate who is considering where to work after graduation. For each profile, the researchers identify a set of sub-indicators from the relevant six functional areas that reflect a city’s fit with the user group’s needs and circumstances.
The city rankings and scores vary considerably from one actor group to another. While San Francisco comes in 21st in the overall Global Power City Index, its rank rises to 9th for Researchers and 11th for Artists. Seemingly somewhat curious for such a famous travel destination, it only ranks 27th for Visitors.
More generally, major European cities tend to rank relatively highly compared with their positions in the overall index for Artists, Visitors and Residents. U.S. cities are particularly attractive destinations for Researchers, with all five (New York (1), Boston (5), Los Angeles (8), San Francisco (9) and Chicago (12)) placing in the top twelve spots. (Click on the image to view the full-size table in a separate browser tab or window.)

The actor-specific rankings are interesting and informative, but their explanatory power and relevance may be hindered to some degree by what seems to be a rather prescriptive approach to the analysis. We would be curious to see how the rankings would compare if they were based on a random sample of survey responses for each actor group.
GPCI 2011 Study Background
The Global Power Cities Index (GPCI) 2011 is edited and published by The Mori Memorial Foundation’s Institute for Urban Strategies, a Japanese foundation based in Tokyo, which helps explain why Tokyo receives special consideration in the analysis. The Institute for Urban Strategies is chaired by Professor Heizo Takenaka of Keio University in Tokyo. In addition to Prof. Takenaka, the steering committee for the GPCI 2011 includes Sir Peter Hall of University College London, Prof. Saskia Sassen of Columbia University, Prof. Emeritus Richard Bender of the University of California, Berkeley, and Hiroo Ichikawa, Principal of the GPCI 2011 working group as well as Professor and Dean of the Graduate School of Governance Studies at Meiji University.
This article is based on the summary version of the report on the Global Power City Index 2011, which was published October, 2011. The Mori Memorial Foundation’s site indicates the complete report will be available for on-line purchase later this year.
Related pages and content:
Country profiles and topic pages: Japan, China, South Korea, India, Brazil, BRIC Countries, Development, Sustainability, Globalization, World Rankings
Tokyo page, New York City page
World Cities: Best Quality of Living and Liveability