
The Global Cities Index ranks 65 of the world’s most influential urban centers on five dimensions of globalization. New York, London, Tokyo, Paris, Shanghai and others all vied for top honors in business activity, human capital, information exchange, cultural experience, and political engagement.
What Makes a City Global?
Global cities are “crowded with those who are creating the future, noisy with the clash of deals and ideas, frantic in the race to stay ahead,” in the engaging words of the authors of The Urban Elite, the A.T. Kearney (ATK) Global Cities Index 2010. The study is a collaboration of ATK, The Chicago Council on Global Affairs, and Foreign Policy magazine.
When it comes to the Urban Elite, “the world is not flat. Instead, it is a landscape of peaks and valleys, and global cities are the peaks. Often they soar above the hinterland around them, having more to do with each other than with their own countrymen.” In addition to the requisite international corporations and power dining rooms, global cities feature fine universities, great art and music, think tanks, and jazz bars. To the authors of the latest Global Cities Index, the combined effect and defining characteristic of these admirable qualities can be summed up in a single word, “clout.”
Global Cities Index 2010
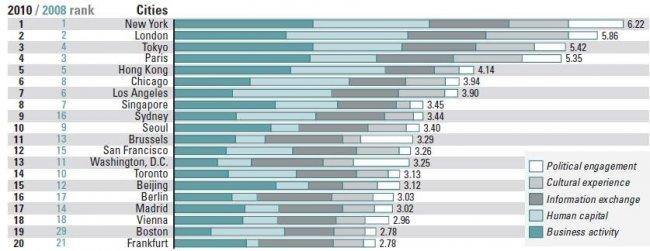
The chart below presents the overall global city scores for 2010 and rankings for both 2010 and the prior 2008 analysis. (Click on the image to see a larger version.)

A quick glance at the scores for the top 10 cities reveals a pronounced stratification of significantly different results. There is a fairly wide gap between the three top global cities, with No. 1 New York at 6.22, No. 2 London at 5.86, and No. 3 Tokyo at 5.42. The gap between the fourth and fifth spots is even larger with Paris (5.35) outscoring Hong Kong (4.14) and Chicago (3.94) by more than 29 percent. In seventh place at 3.90, Los Angeles nearly ties Chicago and comes in at least 13 percent higher than Singapore (3.45), Sydney (3.44), and Seoul (3.40) in spots eight through ten.
Cities from developing countries are scattered throughout the ranking but mostly fall toward the lower end of the list. Beijing (3.12) and Shanghai (2.78) rank 15 and 21, respectively. Other cities from the BRIC countries (Brazil, Russia, India, China) come in at spots 25 (Moscow, 2.61), 35 (Sao Paulo, 2.32), 45 (New Delhi, 1.73), 46 (Mumbai, 1.69), and 49 (Rio de Janeiro, 1.60).
One of the more interesting results in the table comes from Japan. While the Japanese capital city of Tokyo ranks third out of 65 countries, Japan’s second largest city, Osaka, home to the Kansai International Airport, only manages a ranking of 47, below a number of other global cities in far less developed Asian countries, including Bangkok and Taipei.
This comparison may not be entirely fair since most of the cities on the list, like Bangkok and Taipei, are also country capitals. These findings suggest that capital cities are, not surprisingly, likely to have more of the characteristics of a global city and that it can be difficult for more than one or two cities in many countries to crack the top ranks of global cities. While London and Paris take home the No. 2 and No. 4 overall rankings, respectively, no other U.K. or French cities even make the list of the top 65 global cities. On the other hand, the U.S., China, India, Brazil, Germany, and Italy are all exceptions to this tendency by placing more than one city in the list.
The U.S. takes up the most spots on the list with a total of seven of the top global cities, ranging from Houston, Texas at 38 with a score of 2.2 to New York City at No. 1 with a score of 6.22.
Method, Factors, and Weighting
According to the study, “Globalization is the increasing integration of economics, societies and cultures around the world. …. It is a process driven by technology that leaps frontiers. It is symbolized by movement – of money, goods, people, ideas, and jobs.”
The overall global city scores and ranking are based on a weighted, composite value of five dimensions of globalization: business activity (30%), human capital (30%), information exchange (15%), cultural experience (15%), and political engagement (10%). Each of the five dimensions is comprised of four to six sub-measures, for a total of 25 individual measures of globalization.
Business Activity (30%)
The chart below shows the business activity scores for 2010 and rankings for both 2010 and the prior 2008 analysis.

Business activity is scored and ranked on the basis of five factors: number of international conferences, flow of goods (air and port), capital markets, number of companies among the top 40 global service firms, and number of Fortune Global 500 companies with headquarters in the city.
New York (6.4), Tokyo (6.4), and Paris (6.3) take the top three spots with nearly identical scores but get there in different ways. New York’s capital markets score dwarfs that of all other cities, including London and Tokyo. Paris hosts far more international conferences than its top three peers. Tokyo is home to more headquarters of Fortune Global 500 cities than any other global city in the business activity top 10.
Not surprisingly to anyone who has delighted in witnessing Hong Kong’s bustling, criss-crossing harbor melee of massive cargo ships and feisty junks, Hong Kong, as well as Singapore and Shanghai, stand out for their port services and involvement in facilitating international trade and the worldwide flow of goods.
Human Capital (30%)
The table below shows the human capital scores for 2010 and rankings for both 2010 and the prior 2008 analysis.

The ATK authors maintain, “human capital measures how well the city acts as a magnet for diverse groups of people and talent.” Human capital is scored and ranked on the basis of five factors: size of a city’s foreign-born population, quality of its universities, number of international schools, international student population, and percentage of residents with university degrees.
London and New York achieve significantly higher scores than the other eight cities in the top 10. Tokyo scores abnormally high on inhabitants with tertiary degrees and similarly low on the size of its foreign-born population. Balmy Sydney attracts the largest portion of international students but is less worldly on other human capital measures.
Thanks to their disproportionate claims to top universities, U.S. cities take six of the top ten spots for human capital.
Information Exchange (15%)
The chart below shows the information exchange scores for 2010 and rankings for both 2010 and the prior 2008 analysis.

The ability to access the right information at the right time can have big implications for the success of business deals, political negotiations, and cultural collaborations. According to the study authors, “Whether it’s a Bangladeshi farmer checking market prices via his cell phone or a hedge fund manager monitoring news from a New York skyscraper, high-speed access to information can make the difference between success and failure.”
In the global cities index, information exchange is scored and ranked on the basis of four factors: number of international news bureaus, level of censorship, amount of international news in the leading local papers, and broadband subscriber rate.
Compared to the other four dimensions of globalization, the individual and overall scores for information exchange are consistently high and close for the top 10 cities. Cities in European countries perform relatively well on the information exchange category, with the German cities of Berlin and Frankfurt taking two of the top 10 spots.
Cultural Experience (15%)
The table below shows the cultural experience scores for 2010 and rankings for both 2010 and the prior 2008 analysis.

Cultural experience is scored and ranked on the basis of six factors: museums, visual and performing arts, major sporting events a city hosts, international travelers, diverse culinary establishments, and sister city relationships.
At a full 1.4 points better than runner-up Paris (6.3), London (7.6) earns top honors for cultural experience with consistently high scores across all cultural measures other than sister cities. Art patrons, foodies, avid travelers, and sports fanatics can all enjoy their fill in the cosmopolitan U.K. capital.
Moscow and Berlin stand out for the largest endowments of museums. Tokyo, New York, and the other U.S. cities do well with feeding the foodie craving for diverse culinary offerings.
Relatively few international visitors hold back the seven through ten spots, including San Francisco, Berlin, Buenos Aires, and Chicago.
Political Engagement (10%)
The chart below shows the political engagement scores for 2010 and rankings for both 2010 and the prior 2008 analysis.

Political engagement is scored and ranked on the basis of five factors: international organizations, embassies and consulates, think tanks, political conferences, and local institutions with international reach.
Washington, D.C., New York, and Brussels handily outscore the remaining seven cities in the top 10 list for political engagement. Think tanks gravitate disproportionately to Washington and Tokyo, to a lesser extent. As the seat of the European Commission, Brussels takes the title for hosting the most political conferences.
Weighting and Ranking Results
The weights assigned to each of the five globalization dimensions above have a large impact on the overall globalization scores and ranking. While the weighting feels reasonable and appropriate in many respects, a fair case could probably be made for increasing the relative importance of political engagement and information exchange.
The scores for information exchange look to be relatively consistent for most cities other than some near the bottom of the table and places where the newly added censorship measure plays a bigger role, including China and Russia.
At one-third the importance of business activity, political engagement may be overly discounted as a contributing factor in globalization. Boosting the relative importance of political engagement could lead to a noteworthy improvement in the overall scores and positions of Washington, D.C. and Brussels and a corresponding decrease in the overall scores and ranks of Singapore and Seoul.
Other City Lists and Rankings
The Global Cities Index stands out for its focus on identifying and quantifying the dimensions of globalization at the city level. Other city lists and rankings get at different aspects of life in global cities and urban areas. Although there are clearly great benefits to residing in global cities, the intensity, stimulation, density, and cost of living in bustling, worldly metropolises also have important implications for quality of life and choosing the best location to live and work.
For those in top tax brackets, it’s hard to argue with the allure of inhabiting a cosmopolitan, international city. However, the financial reality is quite different for many residents and workers in the world’s most global cities. Sky-high housing costs often lead many to make their homes in less-than-ideal locations and neighborhoods or outside the city limits altogether. Large inequalities in income, living standards, and opportunities tend to accompany the high stakes and lofty demands of big city life. In the words of the Urban Elite authors, too often you can recognize the global cities “by the poverty of those on the fringe, lacking the skills and education to play the global game.”
Mercer, the Economist Intelligence Unit (EIU), UBS (a Swiss bank), and ECA International all conduct regular studies to determine the relative cost of living or purchasing power of wages and quality of life in different cities around the world. Multinational companies and other organizations use these survey findings to help set remuneration packages and cost of living adjustments (COLA) for international transfers and expatriate compensation.
UBS conducted its latest standardized Prices and Earnings survey in 73 international cities in 2009 to construct rankings of the most expensive cities, the richest cities in terms of personal earnings, the richest cities in terms of purchasing power, and the iPod index.
The iPod index is a novel way of calculating the cost of living in cities around the world. In this method, cities were ranked by the number of working hours its takes to buy an iPod Nano. While interesting, it’s not clear how relevant the iPod index is to measuring the relative cost of other things that seem to have a bigger impact on a city’s relative cost of living, such as housing, food, and essential local services.
Final Thoughts
Global cities are engines and archives of growth, change, culture, and ideas. They are great places where much of the world goes to live, learn, work, and create. They are also challenging, often difficult places for everyone, but especially for those on the fringes who do not share the same advantages as their fellow urbanites.
On the other hand, the beauty of global cities is also that many of their benefits do not require a price of admission other than showing up. For many city dwellers, the chance to rub elbows, swap stories, and share experiences with anyone and everyone from all manner of national, ethnic, and cultural backgrounds is more than enough reason to call a global city home.
Before signing off, here are just a few inspiring pictures from Foreign Policy’s photo essay for the Global Cities Index 2010.


Related articles and content:
World Cities Page – Rankings, Development Facts and Article Links
World Cities: Best Quality of Living and Liveability
Globalization – Background, Rankings and Articles
Behind Norway’s #1 Prosperity Index Rating
China Meets Chicago – Most China-Friendly U.S. City
World Rankings – Globalization, Development, Quality of Life, Cities and More
Visit the Global Sherpa home page.
Sources and further reading:
Fung, Brian and Jared Mondschein. Metropolis Now – Stunning Images of the World’s Top Global Cities. Foreign Policy. August 16, 2010.
Hales, Mike, Samantha King and Andres Mendoza Pena. The Urban Elite – The A.T. Kearney Global Cities Index 2010. A.T. Kearney.
Sassen, Saskia. The Immutable Intersection of Vast Mobilities. Urban Age.
Vancouver, Melbourne and Vienna Named World’s Most Liveable Cities (A report by the Economist Intelligence Unit). Environment. City Mayors. February 14, 2010.