
The toppling of governments in Egypt and Tunisia sparked protests across Arab countries in Africa and the Middle East leaving us hanging on the question of what will happen next? We examine the Economist’s Shoe-thrower’s Index and alternate approaches to ranking countries’ vulnerability to political unrest, instability and possible revolution.
Arab Revolution and the Shoe-thrower’s Index
The Shoe-thrower’s Index is based on a set of indicators thought to feed unrest and political instability. After assigning weights to each indicator and crunching the numbers, the Economist arrived at the chart below of Arab countries’ vulnerability to revolution. (Click on the image below to see a larger version.)

The index produces some interesting results. Tunisia scores lower than might be expected based on actual events. While an index intended to shed light on future developments shouldn’t be constructed to fit the past, such curious divergences invite further consideration and attempts to experiment with other prospective indicators.
Indicators and Weights
The Economist’s Shoe-thrower’s chart is based on the following indicators and weightings.
o 35% – Share of the population under age 25
o 15% – Number of years the government has been in power
o 15% – Corruption index (source: Transparency International)
o 15% – Lack-of-democracy index (source: EIU)
o 10% – GDP per person
o 5% – Censorship index (source: Freedom House)
o 5% – Absolute number of people younger than 25
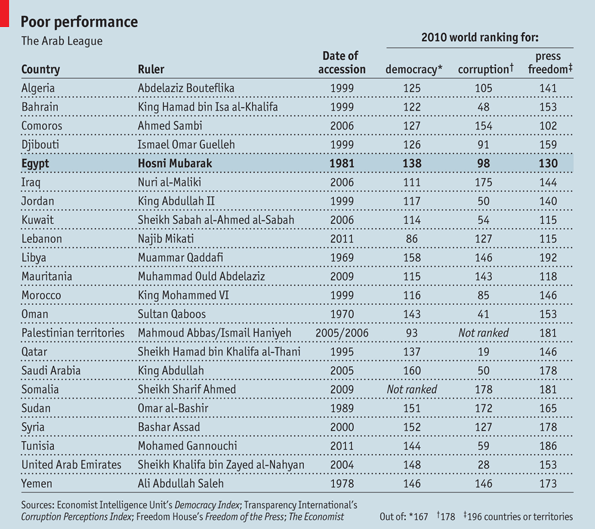
A related chart from the Economist shown below presents data for certain indicators for the 22 countries in the Middle East and Africa who are members of the Arab League (“all of them dictators, bar those of Lebanon, Iraq and the Palestinian territories, a trio of flawed exceptions,” according to the magazine). (Click on the image to see a larger version.)

The value of any index or analysis is only as good as the quality of the underlying data. The Economist points out that the limited availability of reliable data for the subset of Arab League countries constrained the choice of potential indicators. For example, unemployment data were considered “too spotty to compare.”
Reconstructing the Index
The table below represents an attempt at reconstructing the data and scores for the index. Some of the inputs and the final scores don’t match up exactly as hoped, but the findings in the table still help shed some light on the relative contributions of the indicators. (Click on the image to see a larger version.)

Breaking Down the Indicators
A key driver of the index values and overall ranking is the reigning ruler’s and political regime’s years in power, along with the percent of a country’s population under the age of 25 and the data from Transparency International’s Corruption Perceptions Index.
Government Leadership and Regime Years in Power
Mubarak’s 30-year reign and Tunisia’s Ben Ali’s 23-year rule were certainly big factors in their unceremonious ousters. However, the data are not as well-suited to the analysis of countries with recent leadership transitions where changes in government postings do not reflect the persistence of entrenched political leadership, ideologies, and policy directions.
For example, while the chart above puts the accession date for Bahrain’s current ruler at 1999, Bahraini demonstrators have demanded a new cabinet that does not include Prime Minister Sheikh Khalifa Bin Salman Al Khalifa, who has been in office for 40 years. Moreover, years in office may not directly correspond to the degree of public discontent.
One solution to these issues might involve substituting a measure of public attitude toward government leadership from opinion poll data or other sources. Another might simply be to see how the results are affected by removing this indicator altogether.
Youth Attitudes, Opinion and Participation
The biggest contribution by far (35 percent against the next highest weighting of 15 percent) is assigned to the percent of a country’s population under the age of 25. Rather than just a large presence of passionate youth, the key driver here seems to be the lack of jobs for young workers and their feelings about the shortage of employment opportunities and life prospects. For example, jobless youths have taken Sudan’s president, Omar al-Bashir, to task for losing South Sudan and failing to raise living standards.
To the extent that joblessness is consistently high across Arab League countries in the Middle East and Africa, the youth population indicator can be a good proxy for resentment toward the lack of opportunity. While reliable statistics are hard to come by, the limited data that are available suggest that this is likely to be the case for a number of countries. On the other hand, the relatively high weighting assigned to this indicator also magnifies the effect of any discrepancies between population and unemployment statistics.
Alternative Approaches and Rankings
In a world less constrained by data issues, we might want to investigate other potential determinants of political unrest and instability, in addition to the considerations raised above.
o Income inequality can breed resentment and discontent and signal economic difficulties, uneven development and government policy shortcomings.
o GDP per person doesn’t necessarily take into account the more powerful motivations of those living near or below the poverty line. While the middle class has been a key force behind Egypt’s revolution, the large number of Egyptians who live on the poverty line is a further sign of the country’s economic problems and source of frustration with government policies. As of 2005, 18.5% of Egypt’s roughly 70 million people lived on $2 a day or less at purchasing power parity (PPP) according to data from the World Bank.
o Both of these factors can make a country’s people more vulnerable to and resentful of high food prices and other economic and social hardships that take a toll on the middle class as well as the poor. For example, sensing their precarious positions, the leaders of Jordan, Algeria and Libya have all reduced taxes on imported food or lowered the prices of essential staple food items.
o In addition, other subjective factors that are far more difficult to quantify could be just as important to realizing the necessary capabilities of the opposition movement and reaching the revolutionary tipping point, including: the capabilities and persuasiveness of revolutionary leaders, cultural pride, and belief in a sense of entitlement to just governance and a better way of life.
Income and Corruption
Low incomes, corruption and unemployment or a lack of job opportunities were cited as the most important reasons for public discontent and protests in a poll of 343 randomly selected interviewees in Cairo and Alexandria, Egypt’s two biggest cities. The poll was conducted February 5-8, 2011 and funded by the Washington Institute for Near East Policy (WINEP). Due to the lack of reliable data on unemployment, the table below presents an index ranking constructed from just the income and corruption components of the Shoe-thrower’s Index. (Click on the image to see a larger version.)

Internet, Facebook, Social Media and Cell Phone Access
The internet, Facebook, social media and mobile cellular phone access played important roles in inciting and organizing the protests that led to revolution in Tunisia and Egypt. Many Egyptians consider Wael Ghonim, a Google executive in Egypt who created a Facebook page that attracted millions of visitors, to be one of the unofficial leaders of the anti-Mubarak movement. Ghonim set up the page in the name of Khaled Said, a young businessman who died in police custody in Egypt’s second largest city, Alexandria, in June 2010. During the recent uprising, the chant “We are all Khaled Said” could be heard ringing through Tahrir Square in Cairo.
In a captivating 60 Minutes segment, Bob Simon reported on how unrest and revolution in Tunisia grew out of Facebook postings of the Tunisian government mistreating and shooting at its own people. Mohammed Bouazizi, a young fruit vendor in the small Tunisian town of Sidi Bouzid, helped jump start the revolution by lighting himself on fire in front of the offices of an official who slapped him and tried to take away his livelihood by confiscating a scale Bouazizi used to weigh fruit. His infraction, not having a license, reportedly applies to most every other fruit vendor even though Bouazizi was the one singled out. A Tunisian revolutionary activist, Mhirsi, contended that the revolution probably wouldn’t have taken place without the video and pictures exchanged through Facebook, the only video-sharing platform available in Tunisia.
While data on internet access and mobile phone penetration and usage can be a rapidly moving target that is quickly outdated, the available statistics suggest that mobile cellular access is at least as good in the majority of Arab countries in the index. However, relatively less prevalent mobile phone and internet access in four countries, especially Yemen and Somalia, could make it more difficult for opposition supporters to organize as effectively as they did in Egypt. (Click on the image to see a larger version.)

Flawed but Useful
Predicting a revolution is interesting, yet dicey work at best. While relatively objective measures of economic hardship may set the stage for conflict, the difference between a few riots and a forced transition of power or regime change may come down to subjective factors that determine the capacity for successful opposition and breaching the revolutionary tipping point.
In any case, identifying the factors behind public discontent and political instability can help provide useful lessons for effective development, government policy and foreign relations.
Related articles:
World Food Prices Hit Record High
Analyzing Global Progress: Interpreting the 2010 UNDP Human Development Report and Index
Behind Norway’s #1 Prosperity Index Rating
Click here to go to the Global Sherpa home page.
Sources and further reading:
Economist. Daily Chart – The Shoe-thrower’s Index. February 9, 2011.
Economist. Variously Vulnerable. February 3, 2011.
Wortham, Jenna. Google Praises Executive’s Role in Egypt Revolt. New York Times. February 16, 2011.